

CF444A.DZY Loves Physics
普及/提高-
通过率:0%
时间限制:1.00s
内存限制:256MB


AC君温馨提醒
该题目为【codeforces】题库的题目,您提交的代码将被提交至codeforces进行远程评测,并由ACGO抓取测评结果后进行展示。由于远程测评的测评机由其他平台提供,我们无法保证该服务的稳定性,若提交后无反应,请等待一段时间后再进行重试。
题目描述
DZY loves Physics, and he enjoys calculating density.
Almost everything has density, even a graph. We define the density of a non-directed graph (nodes and edges of the graph have some values) as follows:

where v is the sum of the values of the nodes, e is the sum of the values of the edges.
Once DZY got a graph G, now he wants to find a connected induced subgraph G' of the graph, such that the density of G' is as large as possible.
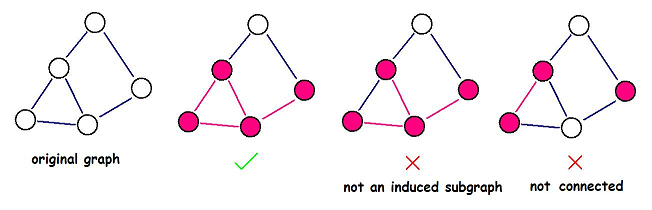
An induced subgraph G'(V', E') of a graph G(V, E) is a graph that satisfies:
 ;
;- edge
 if and only if
  , and edge
  ;
; - the value of an edge in G' is the same as the value of the corresponding edge in G, so as the value of a node.
Help DZY to find the induced subgraph with maximum density. Note that the induced subgraph you choose must be connected.
DZY 热爱物理,也乐于计算密度。
几乎所有事物都有密度,甚至图(graph)也不例外。我们定义一个无向图(其节点与边均具有某些权值)的密度如下:
其中 v 表示所选节点权值之和,e 表示所选边权值之和。
DZY 得到了一张图 G,现在他希望从中找出一个连通的诱导子图 G′,使得 G′ 的密度尽可能大。
图 G(V,E) 的一个诱导子图 G′(V′,E′) 是满足以下条件的图:
- ;
- 边 (u,v)∈E′ 当且仅当 u,v∈V′ 且 (u,v)∈E;
- G′ 中每条边的权值与其在 G 中对应边的权值相同,每个节点的权值亦同。
请帮助 DZY 找出密度最大的诱导子图。注意:你所选出的诱导子图必须是连通的。
输入格式
The first line contains two space-separated integers n (1 ≤ n ≤ 500),  . Integer n represents the number of nodes of the graph G, m represents the number of edges.
The second line contains n space-separated integers x__i (1 ≤ x__i ≤ 106), where x__i represents the value of the i-th node. Consider the graph nodes are numbered from 1 to n.
Each of the next m lines contains three space-separated integers a__i, b__i, c__i (1 ≤ a__i < b__i ≤ n; 1 ≤ c__i ≤ 103), denoting an edge between node a__i and b__i with value c__i. The graph won't contain multiple edges.
第一行包含两个以空格分隔的整数 n(1 ≤ n ≤ 500)、。整数 n 表示图 G 的节点数,m 表示边数。
第二行包含 n 个以空格分隔的整数 xi(1 ≤ xi ≤ 106),其中 xi 表示第 i 个节点的值。图的节点编号为 1 到 n。
接下来的 m 行每行包含三个以空格分隔的整数 ai,bi,ci(1 ≤ ai < bi ≤ n;1 ≤ ci ≤ 103),表示一条连接节点 ai 与 bi、权值为 ci 的边。该图不含重边。
输出格式
Output a real number denoting the answer, with an absolute or relative error of at most 10 - 9.
输出一个实数作为答案,其绝对或相对误差不超过 10−9。
输入输出样例
输入#1
1 0
1
输出#1
0.000000000000000
输入#2
2 1
1 2
1 2 1
输出#2
3.000000000000000
输入#3
5 6
13 56 73 98 17
1 2 56
1 3 29
1 4 42
2 3 95
2 4 88
3 4 63
输出#3
2.965517241379311
说明/提示
In the first sample, you can only choose an empty subgraph, or the subgraph containing only node 1.
In the second sample, choosing the whole graph is optimal.
在第一个样例中,你只能选择空子图,或仅包含节点 1 的子图。
在第二个样例中,选择整个图是最优的。
输入解题思路,AI测评打分。不知道怎么写?